94-2238-ie-reply-1-03-2001-annex
Dieses Dokument ist Teil der Anfrage „Infringement proceedings 1990-1994“
Couneil Directive of 12 December 1991 concerning the
protection of waters against pollution caused by nitrates
from agricultural sources (91/676/EEC)

Article 10 Report for Ireland for the Period 1996-1999

Prepared by the
Environmental Protection Agency

For the
Department of Environment and Local Government

EINS

un ia s L ee
zanmunla Tn uansnnaue Nana nn aaa ne m de annenneenn
EREOENERBERRTINNE ET
BLELLSLZERNVEEEE ELLE ©,
AN ROINN COMHSHAOIL AGUSRIALTAIS ÄITIUIL


DEPARTMENT OFTHE ENYIRONMENT
AND LOCAL GOVERNMENT

February 2001
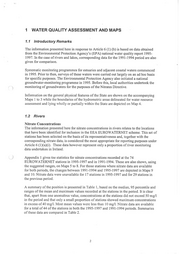
1. WATER QUALITY ASSESSMENT AND MAPS

1.1 Introductory Remarks

The information presented here in response to Article 6 (1) (b) is based on data obtained
from the Environmental Protection Agency’s (EPA) national water quality report 1995-
1997. In the case of rivers and lakes, corresponding data for the 1991-1994 period are also
given for comparison.

Systematic monitoring programmes for estuaries and adjacent coastal waters commenced
in 1995. Prior to then, surveys of these waters were carried out largely on an ad hoc basis
for specific purposes. The Environmental Protection Agency also initiated a national
groundwater-monitoring programme in 1995. Before this, local authorities undertook the
monitoring of groundwaters for the purposes of the Nitrates Directive.

Information on the general physical features of the State are shown on the accompanying
Maps 1 to 3 while the boundaries of the hydrometric areas delineated for water resource
assessment and lyıng wholly or partially within the State are depicted on Map 4.

1.2 Rivers

Nitrate Concentrations

The information presented here for nitrate concentrations in rivers relates to the locations
that have been identified for inclusion in the EEA EUROWATERNET scheme. This set of
stations has been selected on the basis of its representativeness and, together with the
corresponding nitrate data, is considered the most appropriate for reporting purposes under
Article 6 (1)(a)(i). These data however represent only a proportion of river monitoring
data undertaken in Ireland.

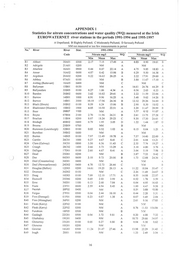
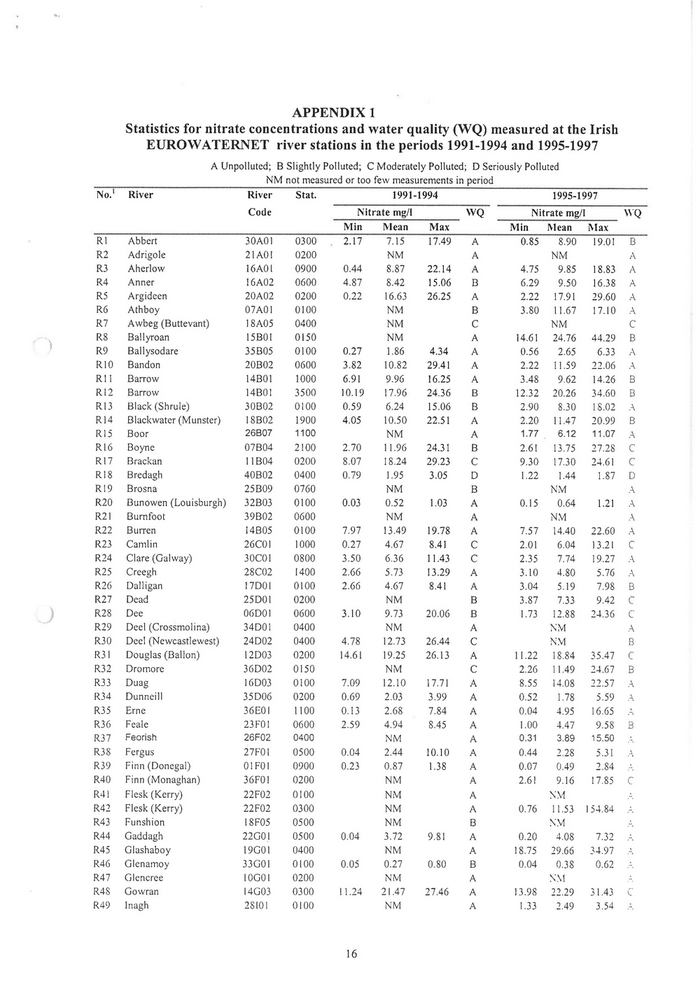
Appendix 1 gives tne statistics for nitrate concentrations recorded at the 74
EUROWATERNET stations in 1995-1997 and in 1991-1994. These are also shown, using
the suggested ranges, on Maps 5 to 8. For those stations where nitrate data are available
for both periods, the changes between 1991-1994 and 1995-1997 are depicted in Maps 9
and 10. Nitrate data were unavailable for 17 stations in 1995-1997 and for 29 stations in
the previous period.

A summary of the position is presented in Table 1, based on the median, 95 percentile and
ranges of the mean and maximum values recorded at the stations in the period. It is clear
that, apart from one anomalous value, concentrations at the stations did not exceed 50 mg/l
in the period and that only a small proportion of stations showed maximum concentrations
in excess of 40 mg/l. Most mean values were less than 10 mg/l. Nitrate data are available
for a total of 44 of the stations in both the 1995-1997 and 1991-1994 periods. Summaries
ofthese data are compared in Table 2.
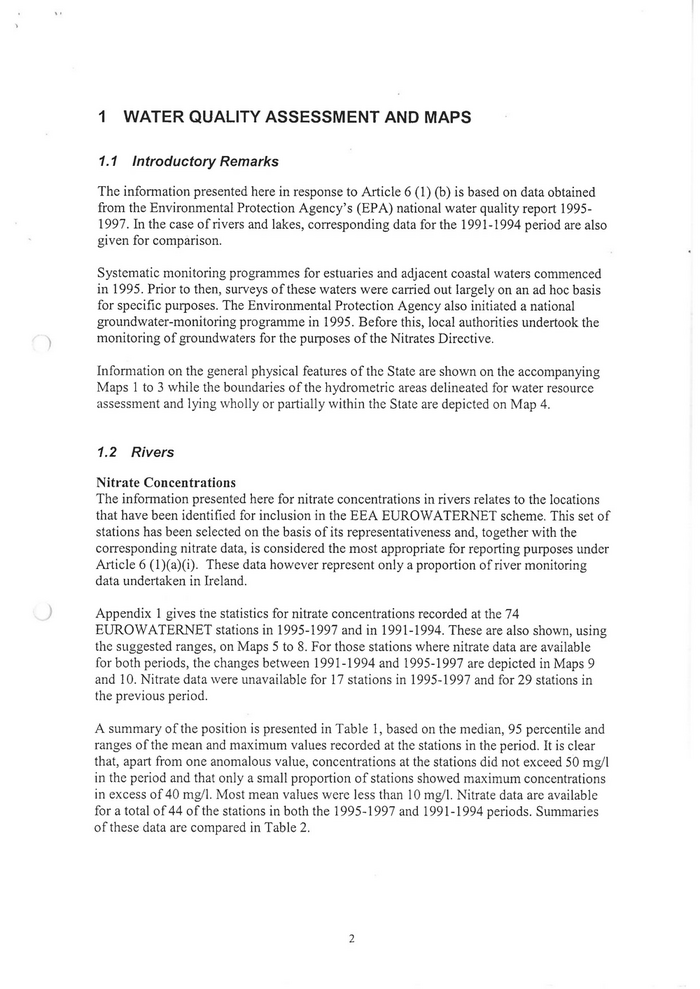
These indices are defined mainly by specific assemblages of macroinvertebrates and
intermediate situations, e.g. 3-4, are also recognised. For national classification purposes,
the indices are used to indicate water quality levels as follows:

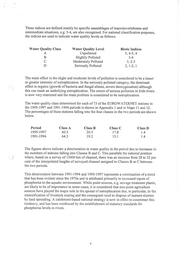
Water Quality Class Water Quality Level Biotic Indices
A Unpolluted 5, 4-5, 4
B Slightly Polluted 3-4
G Moderately Polluted 3, 2-3
D Seriously Polluted 2,1-2,1

The main effect in the slight and moderate levels of pollution is considered to be a lesser
or greater intensity of eutrophication. In the seriously polluted category, the dominant
effect is organic (growth of bacteria and fungal slimes, severe deoxygenation) although
this can mask an underlying eutrophication. The extent of serious pollution in Irish rivers
is now very restricted and the main problem is considered to be eutrophication.

The water quality class determined for each of 73 ofthe EUROWATERNET stations in
the 1995-1997 and 1991-1994 periods is shown in Appendix 1 and in Maps 11 and 12.
The percentages of these stations falling into the four classes in the two periods are shown
below.

Period Class A Class B Class C Class D
1995-1997 60.3 20.5 17.8 1.4
1991-1994 64.3 19.2 15.1 1.4

The figures above indicate a deterioration in water quality in the period due to increases in
the numbers of stations falling into Classes B and C. This parallels the national position
where, based on a survey of 13000 km of channel, there was an increase from 28 to 32 per
cent ofthe interpolated lengths of surveyed channel assigned to Classes B or C between
the two periods.

This deterioration between 1991-1994 and 1995-1997 represents a continuation ofa trend
that has been evident since the 1970s and is attributed primarily to increased inputs of
phosphorus to the aquatic environment. While point sources, e.g. sewage treatment plants,
are likely to be of importance in some cases, it is considered that non-point agriculture
sources have played the major role in the spread of eutrophication due, in particular, to the
intensification of livestock rearing and the consequent need to dispose of manure slurries
by land spreading. A catchment-based national strategy is now in effect to counteract this
tendency, and has been reinforced by the establishment of statutory standards for
phosphorus levels in rivers.
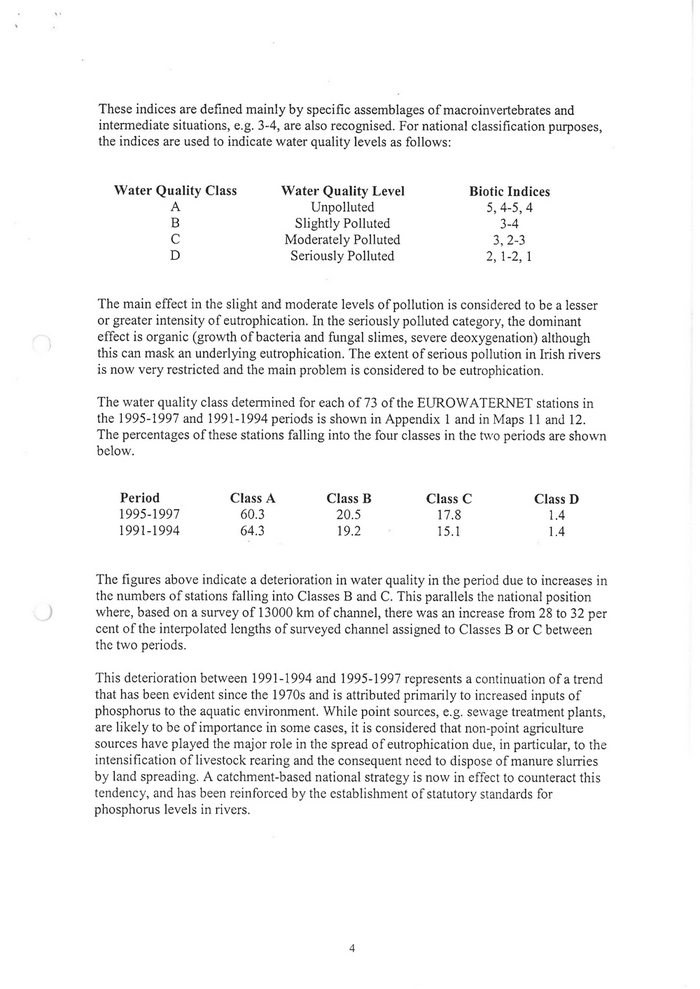
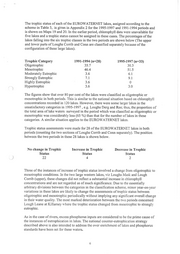
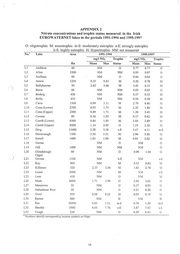
The trophic status of each ofthe EUROWATERNET lakes, assigned according to the
scheme in Table 3, is given in Appendix 2 for the 1995-1997 and 1991-1994 periods and
is shown on Maps 19 and 20. In the earlier period, chlorophyli data were unavailable for
five lakes and a trophic status cannot be assigned in these cases. The percentages of the
lakes falling into the six trophic classes in the two periods are shown below (The upper
and lower parts of Loughs Corrib and Conn are classified separately because of the
configuration of these large lakes).

Trophiec Category 1991-1994 (n=28) 1995-1997 (n=33)
Oligotrophic BE 30.3
Mesotrophic 46.4 51.5
Moderately Eutrophic 3.6 6.1
Strongly Eutrophic | 9

Highly Eutrophic 3.6 0
Hypertrophic 3.6 3.0

The figures show that over 80 per cent ofthe lakes were classified as oligotrophic or
mesotrophic in both periods. This is similar to the national situation based on chlorophyli
concentrations recorded in 120 lakes. However, there were some larger lakes in the
unsatisfactory categories in 1995-1997 , e.g. Loughs Derg and Ree; thus, the proportion of
the total area of lake waters surveyed in the period which was classified as oligotrophic or
mesotrophic was considerably less (65 %) than that for the number of lakes in these
categories. A similar situation applies to the EUROWATERNET lakes.

Trophic status assessments were made for 28 ofthe EUROWATERNET lakes in both
periods (counting the two sections of Loughs Corrib and Conn separately). The position
between the two periods in these 28 lakes is shown below.

No change in Trophic Increase in Trophic Decrease in Trophic
Status Status Status
22 4 2

Three of the instances of increase of trophic status involved a change from oligotrophic to
mesotrophic conditions. In the two large western lakes, viz Loughs Mask and Lough
Corrib (upper), these changes did not reflect a substantial increase in chlorophyli
concentrations and are not regarded as of much significance. Due to the essentially
arbitrary divisions between the categories in the classification scheme, minor year-on-year
variations in these lakes are likely to change the assessments of trophic status between
oligotrophic and mesotrophic periodically without implying any significant overall change
in their water quality. The most marked deterioration between the two periods concerned
Lough Leane at Killarney where the trophic status changed from mesotrophic to strongly
eutrophic.

As in the case ofrivers, excess phosphorus inputs are considered to be the prime cause of
the instances of eutrophication in lakes. The national counter-eutrophication strategy
described above is also intended to address the over enrichment of lakes and phosphorus
standards have been set for these waters,
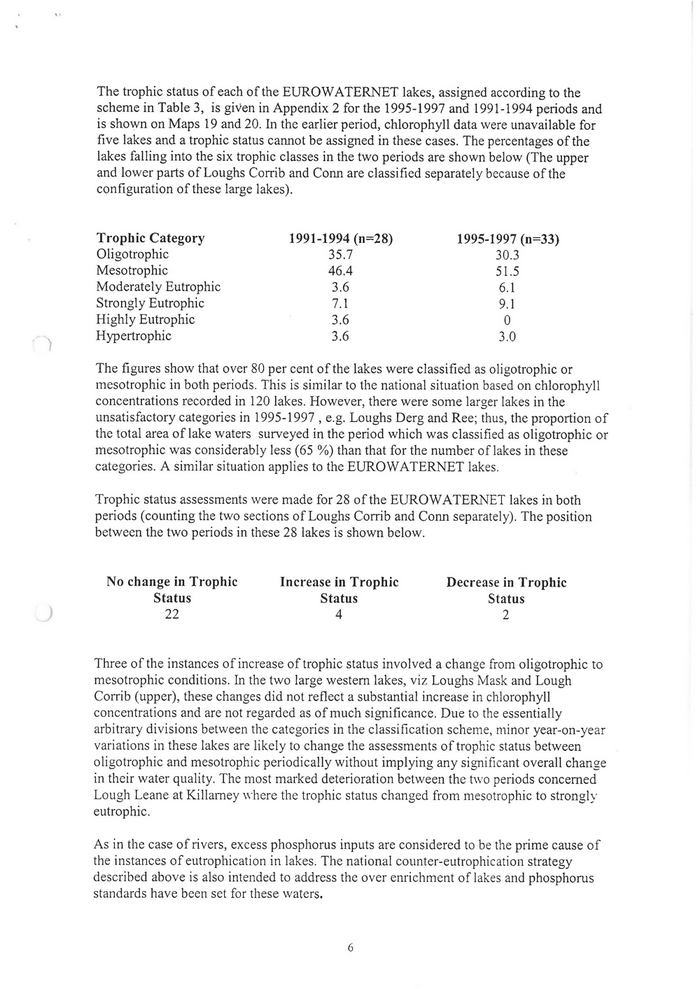
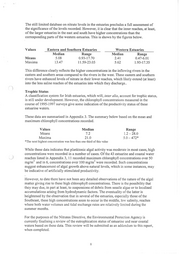
The still limited database on nitrate levels in the estuaries precludes a full assessment of
the significance ofthe levels recorded. However, it is clear that the inner reaches, at least,
of the larger estuaries in the east and south have higher concentrations than the
corresponding parts ofthe western estuaries. This is shown by the figures below.

Values Eastern and Southern Estuaries Western Estuaries
Median Range Median Range

Means 5.08 0.93-17.70 2.41 0.47-6.01

Maxima 13.47 11.59-23.03 5.62 1.93-17.35

This difference clearly reflects the higher concentrations in the inflowing rivers in the
eastern and southern areas compared to the rivers in the west. These eastern and southern
rivers have enhanced levels of nitrate in their lower reaches, which likely extend (at least)
into the less saline reaches of the estuaries into which they discharge..

Trophic Status

A classification system for Irish estuaries, which will, inter alia, account for trophic status,
is still under development. However, the chlorophyll concentrations measured in the
course of 1995-1997 surveys give some indication of the productivity status of these
estuarine waters.

These data are summarised in Appendix 3. The summary below based on the mean and
maximum chlorophyli concentrations recorded.

Values Median Range
Means 72 1.2 — 28.0
Maxima 21.0 5.0 - 472*

*The next highest concentration was less than one third of this value

While these data indicates that planktonic algal activity was moderate in most cases, high
concentrations were recorded in a number of cases. Ofthe 43 estuarine and coastal water
reaches listed in Appendix 3, 11 recorded maximum chlorophyli concentrations over 50
mg/m” and in 6, concentrations over 100 mg/m? were recorded. Such concentrations
suggest enhancement of algal growth above natural levels, which in some instances, may
be indicative of artificially stimulated productivity.

However, to date there have not been any detailed observations of the nature ofthe algal
matter giving rise to these high chlorophyll concentrations. There is the possibility that
they may dus, in part at least, to suspensions of debris from sessile algae or to localised
accumulations arising from hydrodynamic factors. The eventuality ofthe latter is
heightened by the observation that in several of the estuaries, especially those of the
Southeast, these high concentrations seem to occur in the middle, low salinity, reaches
where both water volumes and tidal exchange rates are relatively limited during the
summer months.

For the purposes of the Nitrates Directive, the Environmental Protection Agency is
currently finalising a review of the eutrophication status of estuarine and near coastal
waters based on these data. This review will be submitted as an addendum to this report,
when completed.
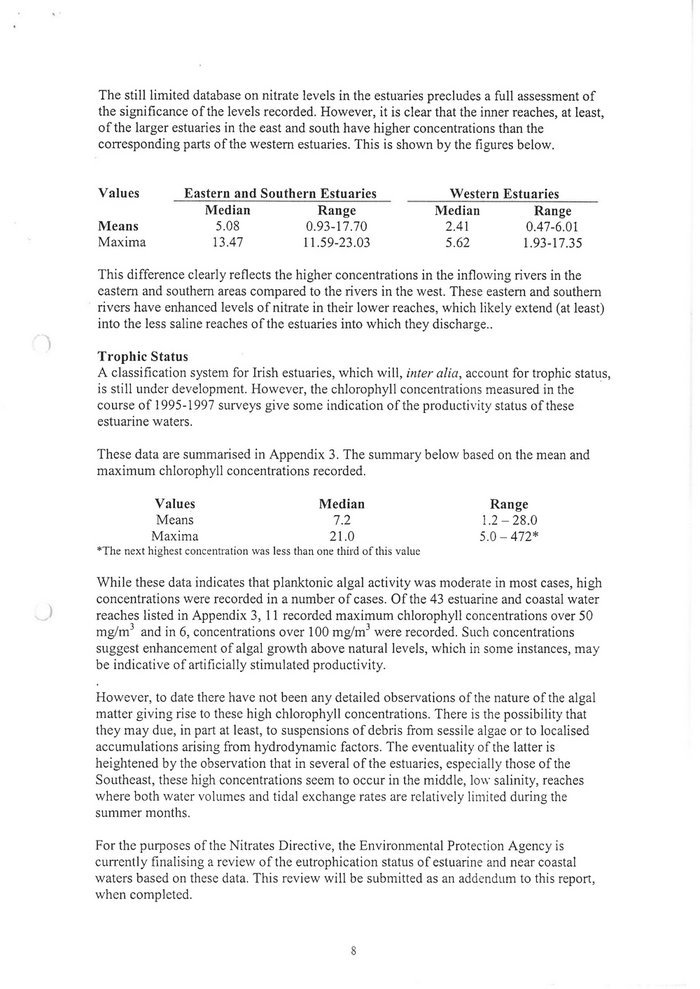
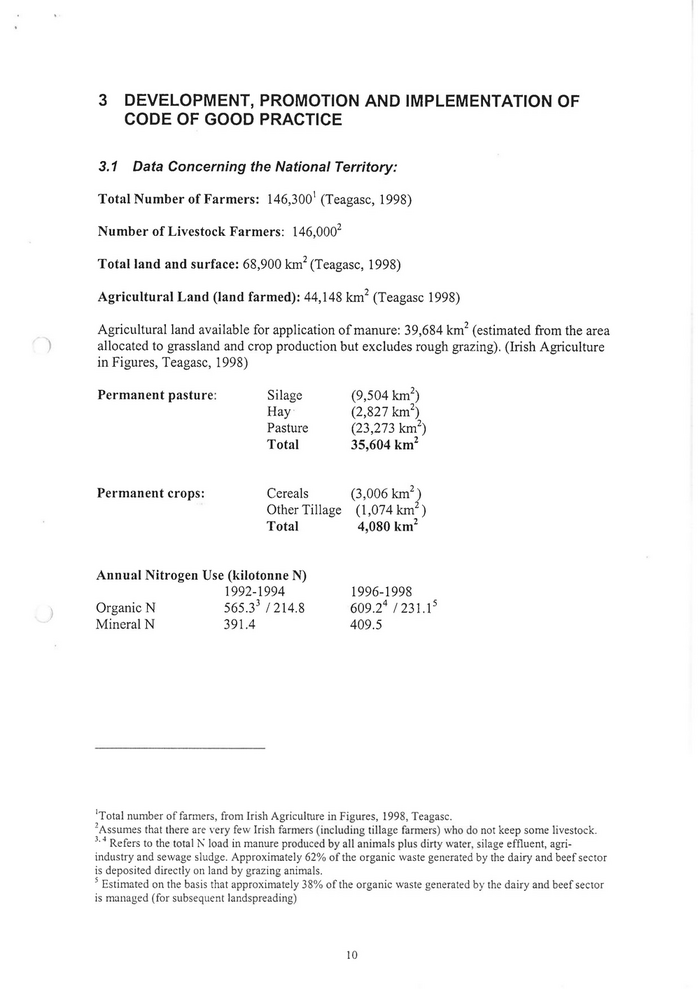
3 DEVELOPMENT, PROMOTION AND IMPLEMENTATION OF
CODE OF GOOD PRACTICE

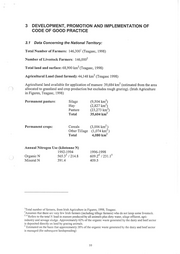
3.1 Data Concerning the National Territory:

Total Number of Farmers: 146,300" (Teagasc, 1998)

Number of Livestock Farmers: 146,000?

Total land and surface: 68,900 km? (Teagasc, 1998)

Agricultural Land (land farmed): 44,148 km? (Teagasc 1998)

Agricultural land available for application of manure: 39,684 km? (estimated from the area

allocated to grassland and crop production but excludes rough grazing). (Irish Agriculture
in Figures, Teagasc, 1998)

Permanent pasture: Silage (9,504 km?)
Hay (2,827 km?)
Pasture (23,273 km’)
Total 35,604 km?

Permanent crops: Cereals (3,006 km? )
Other Tillage (1,074 km?)
Total 4,080 km’

Annual Nitrogen Use (kilotonne N)

1992-1994 1996-1998
Organic N 565.3? / 214.8 609.2* /231.1°
Mineral N 391.4 409.5

"Total number of farmers, from Irish Agriculture in Figures, 1998, Teagasc.

’Assumes that there are very few Irish farmers (including tillage farmers) who do not keep some livestock.
’* Refers to the total N load in manure produced by all animals plus dirty water, silage effluent, agri-
industry and sewage sludge. Approximately 62% ofthe organic waste generated by the dairy and beef sector
is deposited directly on land by grazing animals.

° Estimated on the basis that approximately 38% of the organic waste generated by the dairy and beef sector
is managed (for subsequent landspreading)

10
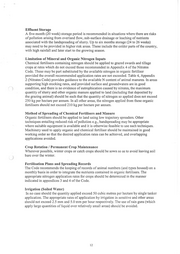
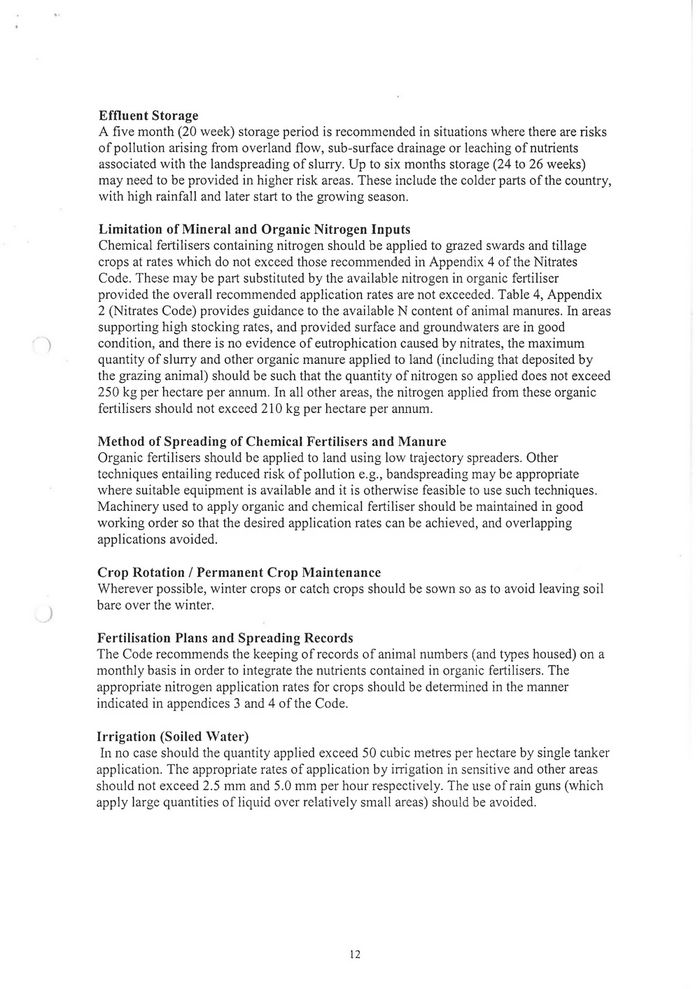
Effluent Storage

A five month (20 week) storage period is recommended in situations where there are risks
of pollution arising from overland flow, sub-surface drainage or leaching of nutrients
associated with the landspreading of slurry. Up to six months storage (24 to 26 weeks)
may need to be provided in higher risk areas. These include the colder parts of the country,
with high rainfall and later start to the growing season.

Limitation of Mineral and Organic Nitrogen Inputs

Chemical fertilisers containing nitrogen should be applied to grazed swards and tillage
crops at rates which do not exceed those recommended in Appendix 4 of the Nitrates
Code. These may be part substituted by the available nitrogen in organic fertiliser
provided the overall recommended application rates are not exceeded. Table 4, Appendix
2 (Nitrates Code) provides guidance to the available N content of animal manures. In areas
supporting high stocking rates, and provided surface and groundwaters are in good
condition, and there is no evidence of eutrophication caused by nitrates, the maximum
quantity of slurry and other organic manure applied to land (including that deposited by
the grazing animal) should be such that the quantity of nitrogen so applied does not exceed
250 kg per hectare per annum. In all other areas, the nitrogen applied from these organic
fertilisers should not exceed 210 kg per hectare per annum.

Method of Spreading of Chemical Fertilisers and Manure

Organic fertilisers should be applied to land using low trajectory spreaders. Other
techniques entailing reduced risk of pollution e.g., bandspreading may be appropriate
where suitable equipment is available and it is otherwise feasible to use such techniques.
Machinery used to apply organic and chemical fertiliser should be maintained in good
working order so that the desired application rates can be achieved, and overlapping
applications avoided.

Crop Rotation / Permanent Crop Maintenance
Wherever possible, winter crops or catch crops should be sown so as to avoid leaving soil
bare over the winter.

Fertilisation Plans and Spreading Records

The Code recommends the keeping of records of animal numbers (and types housed) on a
monthly basis in order to integrate the nutrients contained in organic fertilisers. The
appropriate nitrogen application rates for crops should be determined ın the manner
indicated in appendices 3 and 4 ofthe Code.

Irrigation (Soiled Water)

In no case should the quantity applied exceed 50 cubic metres per hectare by single tanker
application. The appropriate rates of application by irrigation in sensitive and other areas
should not exceed 2.5 mm and 5.0 mm per hour respectively. The use of rain guns (which
apply large quantities of liquid over relatively small areas) should be avoided.

12
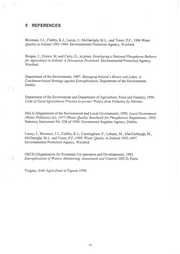
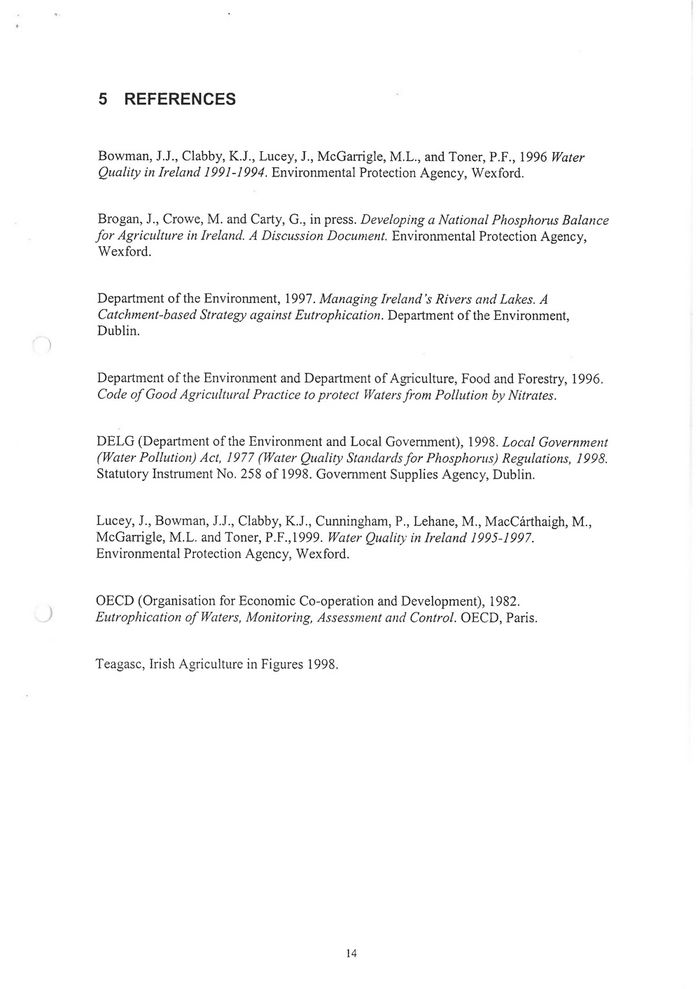
5 REFERENCES

Bowman, J.J., Clabby, K.J., Lucey, J., McGarrigle, M.L., and Toner, P.F., 1996 Water
Quality in Ireland 1991-1994. Environmental Protection Agency, Wexford.

Brogan, J., Crowe, M. and Carty, G., in press. Developing a National Phosphorus Balance
for Agriculture in Ireland. A Discussion Document. Environmental Protection Agency,
Wexford.

Department of the Environment, 1997. Managing Ireland's Rivers and Lakes. A
Catchment-based Strategy against Eutrophication. Department ofthe Environment,
Dublin.

Department of the Environment and Department of Agriculture, Food and Forestry, 1996.
Code of Good Agricultural Practice to protect Waters from Pollution by Nitrates.

DELG (Department ofthe Environment and Local Government), 1998. Local Government
(Water Pollution) Act, 1977 (Water Quality Standards for Phosphorus) Regulations, 1998.
Statutory Instrument No. 258 of 1998. Government Supplies Agency, Dublin.

Lucey, J., Bowman, J.J., Clabby, K.J., Cunningham, P., Lehane, M., MacCärthaigh, M.,
McGarrigle, M.L. and Toner, P.F.,1999. Water Quality in Ireland 1995-1997.
Environmental Protection Agency, Wexford.

OECD (Organisation for Economic Co-operation and Development), 1982.
Eutrophication of Waters, Monitoring, Assessment and Control. OECD, Paris.

Teagasc, Irish Agriculture in Figures 1998.

14
APPENDIX I
Statistics for nitrate concentrations and water quality (WO) measured at the Irish
EUROWATERNET river stations in the periods 1991-1994 and 1995-1997

A Unpolluted; B Slightly Polluted; C Moderately Polluted; D Seriously Polluted
NM not measured or too few measurements in period

No.! River River Stat. 1991-1994 1995-1997
Code Nitrate mg/l wo Nitrate mg/l wo
Min Mean Max Min Mean Max

Rl Abbert 30A01 0300. 2.17 7.15 17.49 A 0.85 890 1901 B
R2 _ Adrigole 21A01 0200 NM A NM A
R3 Aherlow 16AO1 0900 0.44 8.87 22.14 A 4.75 985 1883 A
R4  Anner 16A02 0600 4.87 8.42 15.06 B 629 950 16.38 A
R5 Argideen 20A02 0200 0.22 16.63 26.25 A 222 1791 29.60 A
R6  Athboy 07A01 0100 NM B 380 1167 17.10 A
R7 __ Awbeg (Buttevant) 18A05 0400 NM e NM c
R8 Ballyroan 15B01 0150 NM A 14.61 2476 4429 B
R9 Ballysodare 35B05 0100 0.27 1.86 4.34 A 0.56 2.65 6.33 A
RIO Bandon 20B02 0600 3.82 10.82 29.41 A 2.22 1159 2206 A
Ritt  Barrow 14B01 1000 6.91 9.96 16.25 A 348 962 1426 B
RI2  Barrow 14BO! 3500 10.19 17.96 24.36 B 12.32 2026 34.60 B
R13 Black (Shrule) 30B02 0100 0.59 6.24 15.06 B 290 830 18.02 A
Rl4  Blackwater (Munster) 18B02 1900 4.05 10.50 22.51 A 2.20 1147 20.99 B
Ri5 Boor 26B07 1100 NM A 1.77 6.12 11.07 &
RI6  Boyne 07B04 2100 2.70 11.96 24.31 B 2.61 1375 2728 C
R17  Brackan 11B04 0200 8.07 18.24 29.23 C 930 1730 2461 €
RI8  Bredagh 40B02 0400 0.79 1.95 3.05 D 1.22 1.44 1.87 D
RI9  Brosna 25B09 0760 NM B NM A
R20  Bunowen (Louisburgh) 32B03 0100 0.03 0.52 1.03 A 0.15 0.64 121 A
R21  Burnfoot 39B02 0600 NM A NM A
R22  Burren 14B05 0100 I 13.49 19.78 A 757 14.40 2260 A
R23 Camlin 26C01 1000 0.27 4.67 8.41 & 2.01 6.04 1321 C
R24 Clare (Galway) 30C0l 0800 3.50 6.36 11.43 G 2.35 7714 1927 A
R25  Creegh 28C02 1400 2.66 5.73 13.29 A 3.10 4.80 5.76 A
R26  Dalligan 17DO| 0100 2.66 4.67 8.41 A 3.04 5.19 798 B
R27 Dead 25D01 0200 NM B 3.837 7.33 942 C
R28 Dee 06D01 0600 3.10 9,73 20.06 B 1.73 12.88 2436 €
R29  Deel (Crossmolina) 34DO| 0400 NM A NM A
R30  Deel (Newcastlewest) 24D02 0400 4.78 12.73 26.44 G NM B
R3l Douglas (Ballon) 12D03 0200 14.61 19.25 26.13 A 11.22 1884 35.47 C
R32  Dromore 36D02 0150 NM C 226 1149 2467  B
R33 Duag 16D03 0100 7.09 12.10 17.71 A 8.55 1408 2257 A
R34  Dunneill 35D06 0200 0.69 2.03 3.99 A 0.52 1.78 5359 ı&
R35  Erne 36E01 1100 0.13 2.68 7.84 A 0.04 495 1665 &
R36  Feale 23F01 0600 2.59 4.94 8.45 A 1.00 4.47 9.58

R37  Feorish 26F02 0400 NM A 0.31 3.89 1550
R38  Fergus 27FOL 0500 0.04 2.44 10.10 A 0.44 2.28 331 &
R39 Finn (Donegal) OIFOI 0900 0.23 0.87 1.38 A 0.07 0.49 2.848
R40 Finn (Monaghan) 36F01 0200 NM A 2.61 916 1785 €
R4!  Flesk (Kerry) 22F02 0100 NM A NM >
R42  Flesk (Kerry) 22F02 0300 NM A 0.76 11.53 15484 &
R43  Funshion 18F05 0500 NM B NM &
R44  Gaddagh 22G0| 0500 0.04 3.72 9.81 A 0.20 4.08 732%
R45  Glashaboy 19G01 0400 NM A 18.75 29.66 3497:
R46  Glenamoy 33G01l 0100 0.05 0.27 0.80 B 0.04 0.38 0.62%
R47  Glencree 10G01 0200 NM A NM >
R48  Gowran 14G03 0300 11.24 21.47 27.46 A 13.98 2229 31.43 ©
R49  Inagh 28101 0100 NM A 1.33 2.49 3.54
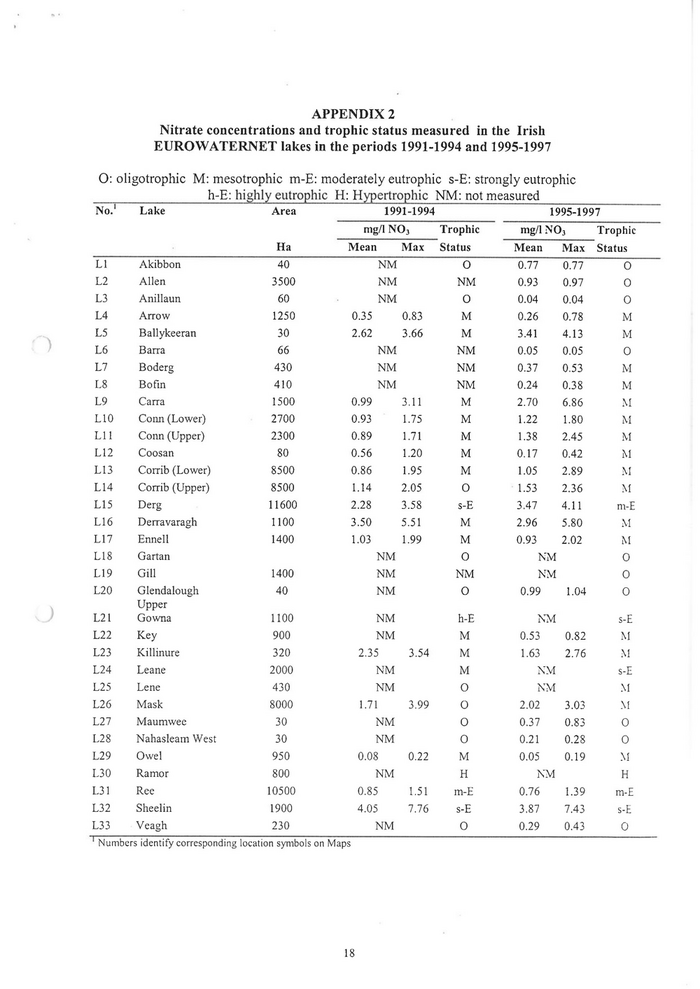
APPENDIX 2
Nitrate concentrations and trophic status measured in the Irish
EUROWATERNET lakes in the periods 1991-1994 and 1995-1997

O: oligotrophic M: mesotrophic m-E: moderately eutrophic s-E: strongly eutrophic

h-E: highly eutrophic H: Hypertrophic NM: not measured

No. Lake Area 1991-1994 1995-1997

mg/l NO; Trophic mg/l NO; Trophic

Ha Mean Max Status Mean Max Status
Li Akibbon 40 NM oO 0.77 0.77 oO
L2 Allen 3500 NM NM 0.93 0.97 oO
L3 Anillaun 60 NM O 0.04 0.04 oO
L4 Arrow 1250 0.35 0.83 M 0.26 0.78 M
L5 Ballykeeran 30 2.62 3.66 M 3.41 4.13 M
L6 Barra 66 NM NM 0.05 0.05 OÖ
L7 Boderg 430 NM NM 0.37 0.53 M
L8 Bofin 410 NM NM 0.24 0.38 M
L9 Carra 1500 0.99 3.11 M 2.70 6.86 M
L10 Conn (Lower) 2700 0.93 1.75 M 1.22 1.80 M
Lil Conn (Upper) 2300 0.89 1.71 M 1.38 2.45 M
L12 Coosan 80 0.56 1.20 M 0.17 0.42 M
L13 Corrib (Lower) 8500 0.86 1.95 M 1.05 2,89 M
L14 Corrib (Upper) 8500 1.14 2.05 OÖ 1.53 2.36 M
L15 Derg 11600 2.28 3.58 s-E 3.47 4.11 m-E
L16 Derravaragh 1100 3.50 5.51 M 2.96 5.80 M
L17 Ennell 1400 1.03 1.99 M 0.93 2.02 M
LI8 Gartan NM OÖ NM OÖ
L19 Gill 1400 NM NM NM OÖ
L20 Glendalough 40 NM oO 0.99 1.04 oO
Upper

L21 Gowna 1100 NM h-E NM s-E
L22 Key 900 NM M 0.53 0.82 M
L23 Killinure 320 2.35 3.54 M 1.63 2.76 M
L24 Leane 2000 NM M NM s-E
L25 Lene 430 NM O NM M
L26 Mask 8000 1.71 3.99 O 2.02 3.03 M
L27 Maumwee 30 NM O 0.37 0.83 OÖ
L28 Nahasleam West 30 NM oO 0.21 0.28 oO
L29 Owel 950 0.08 0.22 M 0.05 0.19 M
L30 Ramor 800 NM H NM H
L31 Ree 10500 0.85 1.51 m-E 0.76 1.39 m-E
L32 Sheelin 1900 4.05 7.16 s-E 3,87 7.43 s-E
L33 Veagh 230 NM O 0.29 0.43 OÖ

D———— m 0000000000001
N

umbers identify corresponding location symbols on Maps

18
